The Straits Times Index
In the chart below, the top panel is called "Trend Expert" :
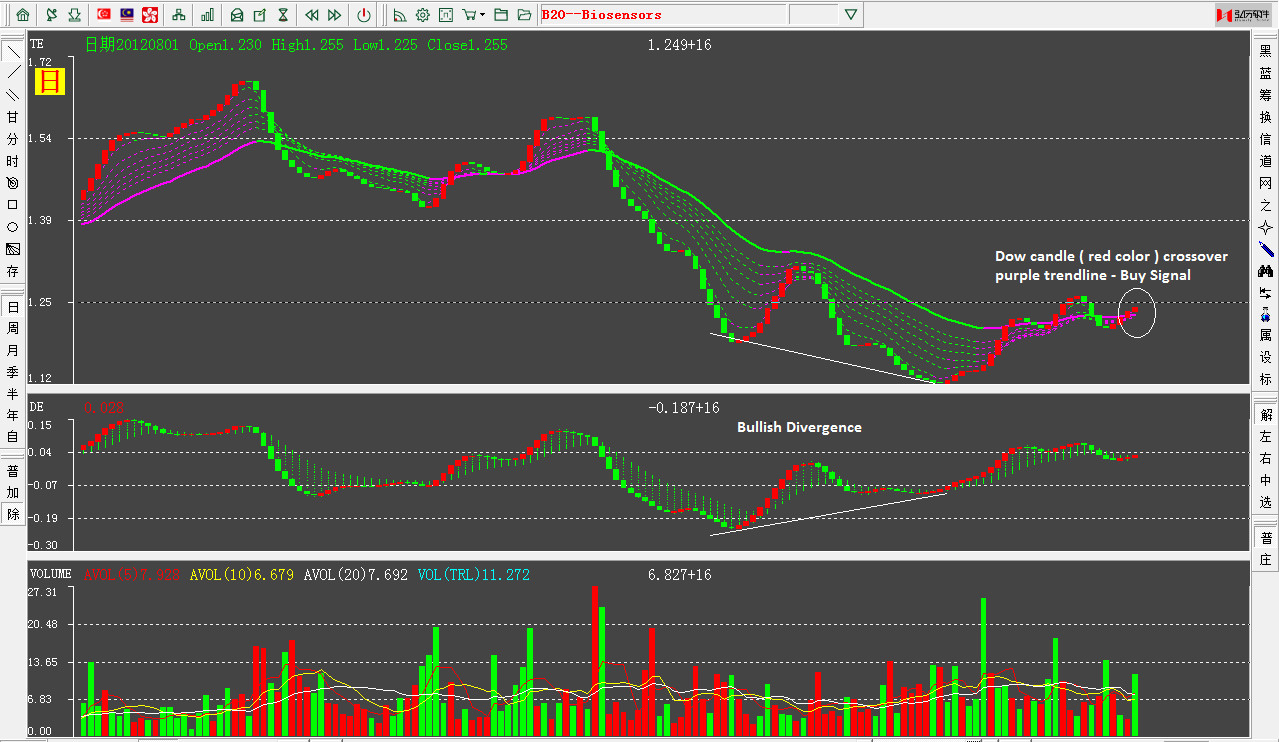
Purple color trendline = Mid-term uptrend
Green color trendline = Mid-term downtrend
Red color candles = Short term uptrend
Green color candles = Short term downtrend
Buy when the trendline turns from green to purple and/or when Dow candles turn from green to red. When the red color Dow candles crossover the purple trendline from below, it is a very bullish signal.
The second panel is called the "Deviation Expert" works like RSI.
Based on the above explanation, the chart below for STI was able to capture all of the major moves since the uptrend started in June. According to this trading system, the uptrend is still intact. However, based on classical technical analysis. The market is near overbought. Although the index closed at 3,051 today ( 12 points above 3,039 ), it is hard to draw a conclusion whether it is a valid breakout yet. Ideally, we need 3% closed above for 3 days to constitute a valid breakout. But 3% on 3,039 which is about 100 points maybe too much. At least 1% or 30 points is the minimum to qualify for a valid breakout ( 3,070 ). Until a valid breakout is confirmed, any long position taken at this level remains risky.

Biosensors
Using the Trend Expert and Deviation Expert, there is a buy signal for Biosensors.
Labels: Market Direction, Stock Pick
posted by Market Wizards @ August 01, 2012
![]()
